Sources#
In prose, objects detected in astronomical images are represented by Source objects. To encompass the large variety of sources encountered in astronomical images, prose fatures three kinds of sources:
PointSource: star
ExtendedSource: comet, galaxy or lensed source
TraceSource: diffracted spectrum, satellite streak or cosmic ray
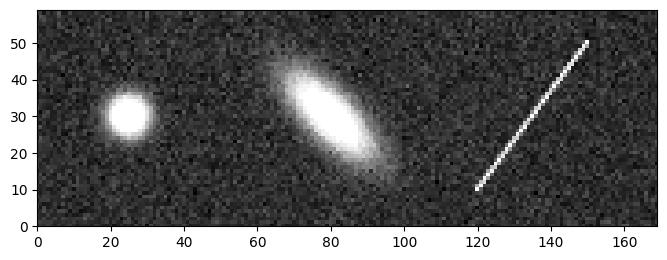
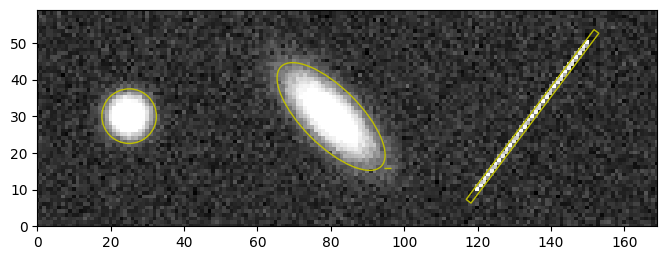
To demonstrate how to use these objects, we will work on the following example image:
from prose.simulations import source_example

im = source_example()
_ = im.show()
Detection#
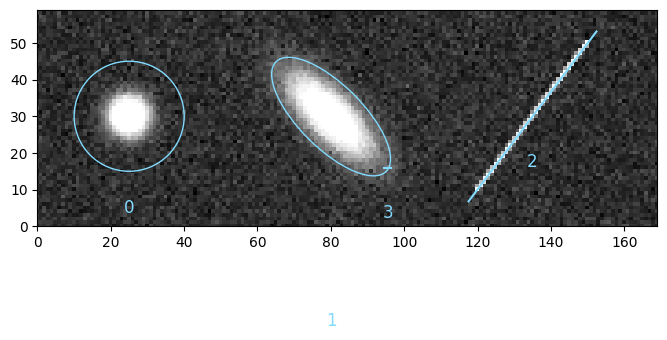
To detect these sources, detection blocks from the prose.blocks.detection module can be used:
from prose import blocks

im = blocks.detection.AutoSourceDetection(min_area=2.0)(im)
_ = im.show()
Note
Source-specific detection blocks are also available, like the PointSourceDetection, as well as blocks with legacy detection algorithms such as DAOFindStars
From here, sources are located in the Image.sources object
im.sources
array([PointSource(a=7.433775312295788, b=7.255093169391493, orientation=1.1922264089238996, coords=array([25.02610197, 30.01423413]), peak=695.7166701091264, i=0, discarded=False),
       ExtendedSource(a=19.25699321106659, b=7.853319649396274, orientation=2.3582193619348897, coords=array([80.07038204, 29.92202729]), peak=606.298205348115, i=1, discarded=False),
       TraceSource(a=28.973487208308285, b=0.8253218070160581, orientation=0.9255078863425344, coords=array([134.97105075,  29.95996439]), peak=511.84648085857623, i=2, discarded=False),
       TraceSource(a=1.0, b=0.0, orientation=0.0, coords=array([95.50449278, 16.        ]), peak=353.982925010811, i=3, discarded=False)],
      dtype=object)
where we can identify the three types of sources, like an extended source at index 1
print(im.sources[1])
⬭ ExtendedSource 1
  ----------------
  coords   80.07   29.92
  a, b     19.26    7.85
  e         0.41
Sources properties#
Such sources contain useful properties and methods used throughout prose to perform image processing.
Apertures#
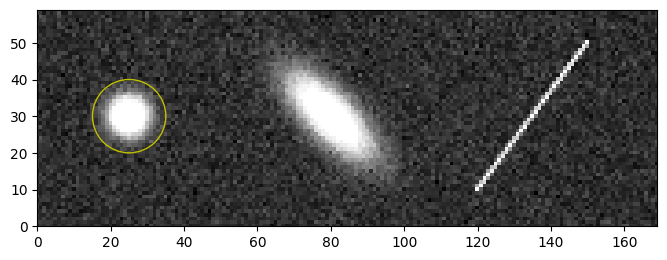
Apertures from the photutils.aperture module can easily be instantiated from a Source object
import matplotlib.pyplot as plt

source = im.sources[0]
aperture = source.circular_aperture(10, scale=False)

# plotted on top of the image
im.show(sources=False)
_ = aperture.plot(color="y")
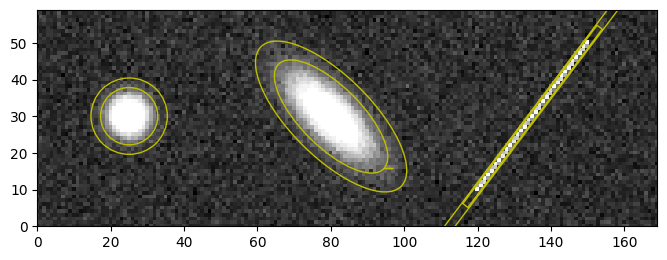
For automatic treatments, the Source.aperture method provides an aperture specific to each type of source
im.show(sources=False)

for source in im.sources:
    aperture = source.aperture()
    _ = aperture.plot(color="y")
and associated annulus methods
im.show(sources=False)

for source in im.sources:
    aperture = source.annulus()
    _ = aperture.plot(color="y")